
Understanding bearish candlestick patterns is essential for traders who want to identify potential market reversals and make informed decisions. These patterns indicate that sellers are taking control of the market, which often signals the beginning of a downtrend. In this comprehensive guide, we will delve deep into the top 10 bearish candlestick patterns that every trader should know.
Understanding Candlestick Patterns
Candlestick patterns are graphical representations of price movements within a specific time period. Each candlestick consists of a body, representing the opening and closing prices, and wicks or shadows, which indicate the highest and lowest prices during the period. Traders use these patterns to predict future price action based on historical data.
What is Pattern Bearish?
Bearish candlestick patterns typically form at the end of an uptrend, signaling a potential reversal to the downside. These patterns often indicate that sellers are gaining control, pushing prices lower. Unlike bullish patterns, which suggest an upward movement, bearish patterns are a warning sign of possible declines.
Top 10 Bearish Candlestick Patterns
1.Bearish Engulfing Pattern
The Bearish Engulfing Pattern is one of the most powerful reversal signals in candlestick charting. It occurs when a small bullish candle is followed by a large bearish candle that completely engulfs the previous day’s body. This pattern typically forms at the top of an uptrend, indicating that the momentum is shifting from buyers to sellers. The larger the bearish candle, the stronger the indication that a reversal is imminent.
Key Characteristics:
- The first candle is bullish.
- The second candle is bearish and larger than the first.
- The pattern signifies a potential reversal from a bullish to a bearish trend.
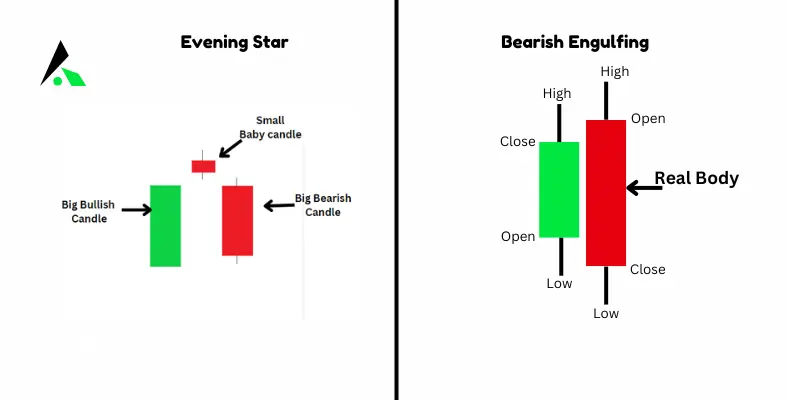
2. Evening Star
The Evening Star is a three-candlestick pattern that signals a strong reversal in an uptrend. The pattern consists of a large bullish candle, followed by a small-bodied candle (which can be bullish or bearish), and then a large bearish candle. The middle candle represents indecision in the market, and the final bearish candle confirms that the sellers are taking control.
Key Characteristics:
- The first candle is bullish with a large body.
- The second candle is small, showing indecision.
- The third candle is bearish and closes well into the body of the first candle.
3.Hanging Man
The Hanging Man is a bearish reversal pattern that appears at the end of an uptrend. It has a small body, a long lower shadow, and little to no upper shadow. This pattern shows that sellers pushed prices significantly lower during the session, but the buyers managed to bring the price back up. Despite this, the appearance of the Hanging Man suggests that the buying pressure is weakening.
Key Characteristics:
- Small body with a long lower shadow.
- Little or no upper shadow.
- It appears at the top of an uptrend.
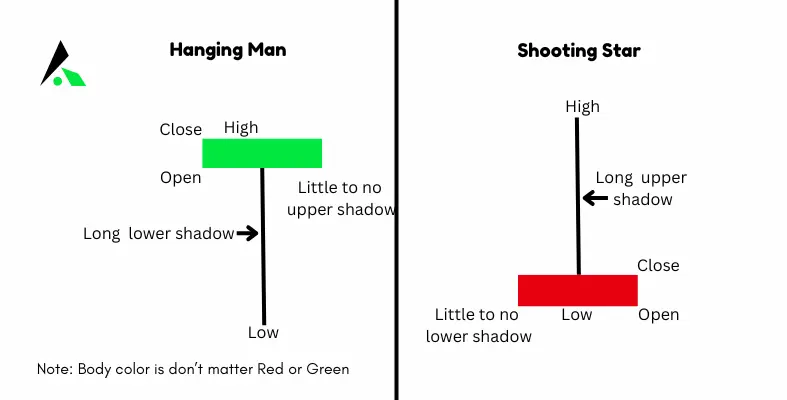
4. Shooting Star
The Shooting Star pattern is a bearish reversal pattern that looks identical to the Hanging Man but occurs at the top of an uptrend. It consists of a small body, a long upper shadow, and little to no lower shadow. The pattern suggests that buyers tried to push the price higher but failed, leading to selling pressure that drives the price back down.
Key Characteristics:
- Small body with a long upper shadow.
- Little or no lower shadow.
- Appears after an uptrend.
5.Dark Cloud Cover
The Dark Cloud Cover pattern forms when a bearish candle opens above the close of the previous bullish candle and closes below its midpoint. This pattern indicates a shift in momentum from the buyers to the sellers, often leading to a reversal in the current uptrend. The strength of this pattern is increased if the bearish candle closes near its low.
Key Characteristics:
- The first candle is bullish.
- The second candle opens higher but closes below the midpoint of the first candle.
- It indicates a potential bearish reversal.
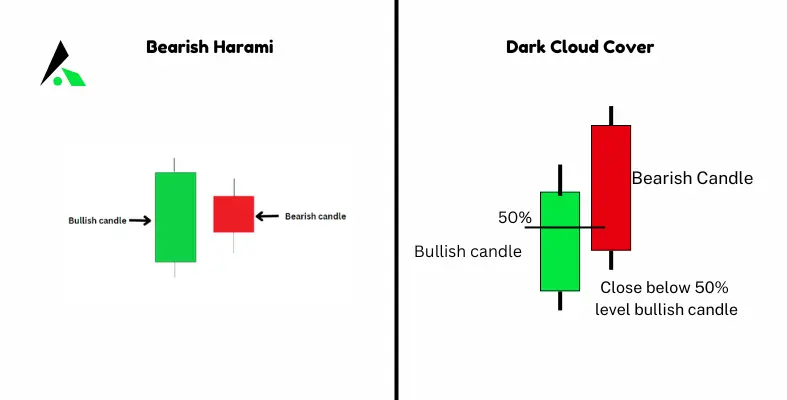
6.Bearish Harami
The Bearish Harami is a two-candlestick pattern where a small bearish or bullish candle is entirely contained within the body of the previous large bullish candle. This pattern indicates that the current uptrend may be losing momentum, and a reversal could be on the horizon.
Key Characteristics:
- The first candle is large and bullish.
- The second candle is small and fits within the body of the first candle.
- Indicates potential reversal from bullish to bearish.
7.Gravestone Doji
The Gravestone Doji is a bearish reversal pattern that forms when the open, low, and close prices are all at or near the same level, and there is a long upper shadow. This pattern suggests that buyers tried to push the price higher but failed, leading to selling pressure that brings the price back to the opening level.
Key Characteristics:
- Long upper shadow with little to no lower shadow.
- The open, low, and close are at the same level.
- Signals a potential bearish reversal.
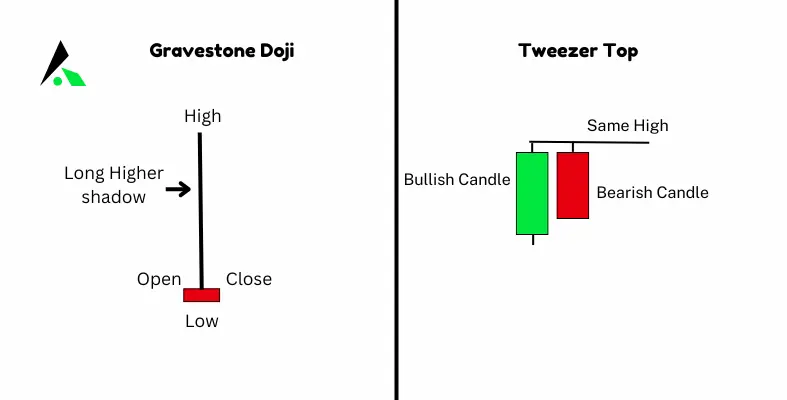
8.Tweezer Tops
The Tweezer Tops pattern is a two-candlestick formation that signals a potential bearish reversal. It occurs when two candles have nearly identical highs, indicating strong resistance at a certain price level. The first candle is typically bullish, followed by a bearish candle that signals a shift in market sentiment.
Key Characteristics:
- Two candles with almost identical highs.
- The first candle is bullish, and the second is bearish.
- Indicates strong resistance and potential reversal.
9. Bearish Marubozu
The Bearish Marubozu is a single-candlestick pattern that signifies strong selling pressure and is often seen as a sign of further downward movement. The term “Marubozu” is derived from Japanese, meaning “bald” or “shaved,” which reflects the candlestick’s lack of wicks or shadows. Here’s what characterizes a Bearish Marubozu:
- No Upper Shadow: The candle opens at the highest price of the day, indicating immediate selling pressure.
- No Lower Shadow: The candle closes at the lowest price of the day, showing that sellers maintained control throughout the trading session.
- Long Body: The body of the candlestick is long and solid, reflecting significant price movement from the open to the close.
The absence of shadows on both ends of the candlestick suggests that the selling was continuous and unchallenged, making the Bearish Marubozu a strong indicator of bearish sentiment.

10.Bearish Kicker
The Bearish Kicker is a two-candlestick pattern that typically occurs at the top of an uptrend or during a period of consolidation, indicating a sharp reversal in market sentiment. It is characterized by:
- The First Candle: A bullish (green or white) candle that closes higher than it opens, continuing the upward momentum.
- The Second Candle: A bearish (red or black) candle that opens at or below the first candle’s opening price and then closes lower, often without any overlap between the two candles.
This dramatic shift from bullish to bearish sentiment is what gives the pattern its “kicker” designation. The lack of overlap between the two candles underscores the sudden and decisive change in market direction.
How to Use Bearish Candlestick Patterns in Trading
Integrating bearish candlestick patterns into your trading strategy can help you anticipate market downturns and make more informed decisions. It’s crucial to look for confirmation from other indicators, such as volume or moving averages, before acting on a pattern. Additionally, always consider the broader market context and avoid relying solely on candlestick patterns for your trades.
Common Mistakes When Trading Bearish Patterns
One of the most common mistakes traders make is misinterpreting bearish patterns or jumping into trades without proper confirmation. It’s important to remember that not every pattern will lead to a reversal, and some may occur within a strong uptrend. Overreliance on candlestick patterns alone, without considering other factors, can lead to poor trading decisions.
Also Learn:
- Top 10 Bullish Candlestick Patterns
- 30 Candlestick Patterns and Charts Every Trader Should Know
- Technical Analysis: Your Key to Stock Market Success
- Mastering Price Action Trading: Unlocking Secrets to Profitable Trades
Final Thought
Bearish candlestick patterns are powerful tools for traders looking to predict market downturns and capitalize on declining trends. By recognizing these patterns and understanding their implications, you can enhance your trading strategy and make more informed decisions. Remember to always consider the broader market context, use confirmation from other indicators, and avoid common pitfalls when trading based on candlestick patterns.
Best Price Action Trading Book
You can read our book Price Action Trading Beginner to Advance to boost your trading knowledge. This book covers basic to advanced price action trading concepts, including trading strategies, candlestick patterns, chart patterns, technical analysis, volume analysis risk management, and trading psychology. you can buy the book from Amazon or Flipkart.
FAQs
What is the most reliable bearish candlestick pattern?
The Bearish Engulfing and Evening Star patterns are among the most reliable, as they often indicate a strong potential for a reversal.
What is the most powerful candlestick pattern?
The most powerful candlestick pattern is the Engulfing Pattern. It signals a strong potential reversal, with the second candle fully engulfing the previous one, indicating a shift in market sentiment.
Can bearish patterns appear in a bullish market?
Yes, bearish patterns can appear in a bullish market, but they may not always result in a significant price decline. It’s essential to consider the overall market context.
How do volume and candlestick patterns relate?
Volume is a crucial factor in confirming candlestick patterns. Higher volume during the formation of a bearish pattern increases the likelihood of a valid reversal.
What is the best bearish candlestick pattern?
The Bearish Engulfing pattern is the best bearish candlestick pattern, signaling a strong reversal with its larger bearish candle engulfing the previous bullish candle.
Are bearish patterns more effective in certain markets?
Bearish patterns tend to be more effective in overbought or weak markets where the potential for a reversal is higher.
How often do these patterns occur?
The frequency of bearish candlestick patterns varies depending on the market and time frame. Some patterns, like the Bearish Engulfing, occur more frequently than rarer patterns like the Bearish Abandoned Baby

