Price action trading remains one of the most effective and reliable methods for analysing financial markets. Instead of depending on lagging indicators or complicated algorithms, we focus directly on price movement, market structure, and trader psychology. Professional traders across forex, stocks, crypto, and commodities rely on price action strategies because they reveal the true intent of buyers and sellers. In this comprehensive guide, we will explore the Learn Powerful Price Action Trading Strategies, explain how to identify high-probability setups, and demonstrate how to improve precision in market entries and exits.
What Is Price Action Trading?
Price action trading is the practice of analysing raw market movement without relying heavily on indicators. Traders interpret candlestick patterns, support and resistance levels, trend direction, and market momentum to make trading decisions. The core principle is simple: price reflects all available market information. By understanding how price behaves at key levels, we gain insight into institutional activity and trader sentiment.
Price action trading works exceptionally well because it:
- Eliminates indicator lag
- Simplifies chart analysis
- Improves decision-making speed
- Works in all market conditions
- Adapts to any timeframe
Whether trading intraday or holding swing positions, price action offers clarity and precision.
Why Professional Traders Prefer Price Action
Professional traders love price action because it works across all timeframes and markets. Whether you trade Bitcoin, gold, EUR/USD, or the Nifty 50, price always follows patterns rooted in human psychology. Fear and greed have existed for centuries, and they continue to shape every candle on a chart.
Another reason professionals favour price action is adaptability. Indicators often fail during changing market conditions. A strategy that works in trending markets may collapse during consolidation. Price action traders, however, can quickly identify whether the market is trending, ranging, or reversing. This flexibility helps them survive different environments.
In 2026, a growing number of experienced traders emphasise data-driven discipline over emotional trading. Many successful traders now combine price action with journaling and strict risk management rather than blindly chasing signals. That’s a crucial lesson for beginners.
Understanding Market Structure
Before applying any strategy, we must understand the market structure. Every market moves through cycles of:
- Higher highs and higher lows in an uptrend
- Lower highs and lower lows in a downtrend
- Consolidation during ranging conditions
Recognising structure allows us to align trades with dominant market momentum.
Bullish Market Structure
A bullish trend forms when the price consistently creates:
- Higher swing highs
- Higher swing lows
Higher Highs and Higher Lows
An uptrend forms when the market creates higher highs and higher lows. Buyers remain in control, and pullbacks often become buying opportunities. Trend traders avoid short-selling strong bullish markets because fighting momentum usually ends badly. The simplest way to profit during an uptrend is to wait for pullbacks into support zones. Imagine climbing a staircase. Price moves upward, pauses, retraces slightly, and continues higher. Smart traders enter during those pauses rather than chasing candles emotionally.
This signals strong buyer control.
Bearish Market Structure
A bearish trend develops when the price forms:
- Lower swing highs
- Lower swing lows
Lower Highs and Lower Lows
A downtrend works oppositely. Sellers dominate the market, creating lower highs and lower lows. During bearish conditions, traders focus on selling rallies instead of buying dips blindly.
One of the biggest mistakes beginners make is assuming every sharp drop is a buying opportunity. Markets can remain bearish far longer than inexperienced traders expect. Professional traders respect trend direction and avoid emotional countertrend trades.
This confirms seller dominance.
Range-Bound Conditions
Markets often consolidate between support and resistance levels before major breakouts occur. During these phases, traders focus on reversals and breakout opportunities.
How Price Reflects Market Psychology?
Every candlestick tells a story. A long bullish candle reveals aggressive buyers stepping into the market. A rejection wick shows sellers defending a level. Small candles often indicate indecision. Once you start viewing charts as emotional battlefields instead of random lines, your perspective changes completely.
Think about a pin bar candle with a long wick rejecting resistance. That wick represents traders who entered too late and got trapped. Institutional players often exploit retail emotions by pushing price beyond obvious levels before reversing direction. This is why understanding liquidity and stop hunts has become increasingly important in today’s algorithm-driven markets.
Successful price action trading is less about predicting the future and more about reacting intelligently to what the market reveals.
Support and Resistance Trading Strategy
Support and resistance levels are foundational concepts in price action trading.
Support Level: Support is an area where buying pressure historically exceeds selling pressure, causing the price to bounce upward.
Resistance Level: Resistance is a price zone where selling pressure historically overcomes buyers, causing price rejection.
How to Trade Support and Resistance?
- Identify major swing highs and lows
- Draw horizontal levels where the price repeatedly reacts
- Wait for candlestick confirmation
- Enter trades near key zones
- Place stop losses beyond the structure
This strategy works because institutional traders often place large orders around these areas.
Candlestick Patterns That Actually Work
Candlestick patterns remain one of the strongest tools in price action trading because they reveal market sentiment instantly.
Pin Bar Strategy
A pin bar features a long wick and small body, signalling rejection from a key level. Bullish pin bars reject lower prices, while bearish pin bars reject higher prices. The secret is location. A random pin bar in the middle of nowhere means little. But a pin bar rejecting major support during an uptrend can produce explosive moves.
Engulfing Candle Setup
Engulfing candles indicate sudden momentum shifts. A bullish engulfing candle completely covers the previous bearish candle, showing buyers regained control aggressively. These setups work especially well after pullbacks. Traders often use engulfing candles as confirmation before entering trend continuation trades.
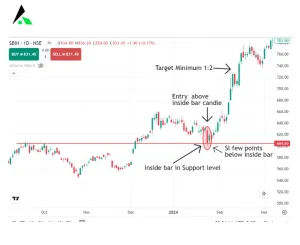
Inside Bar Breakout Strategy
An inside bar forms when a candle remains completely within the range of the previous candle.
This pattern represents:
- Market consolidation
- Reduced volatility
- Potential breakout energy
Trading the Inside Bar
- Place a buy stop above the mother candle
- Place a sell stop below the mother candle
- Trade in the direction of the dominant trend
Inside bars work exceptionally well during strong trending markets.
Trend Trading Using Price Action
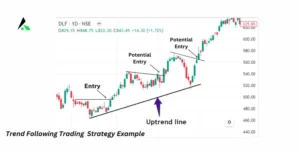
Trend trading remains one of the highest-probability strategies available.
The Pullback Entry Strategy
Instead of chasing price, professional traders wait for retracements.
Steps to Trade Pullbacks
- Identify a strong trend
- Wait for the temporary correction
- Mark support or resistance
- Watch for reversal candlestick patterns
- Enter with trend continuation
This approach improves risk-to-reward ratios while reducing emotional trading.
Breakout Trading Strategies
Breakout trading attracts traders because trends can accelerate rapidly after consolidation. However, not every breakout succeeds. Breakouts occur when price escapes consolidation zones with momentum.
How to Identify Strong Breakouts?
- Tight consolidation range
- Increased volatility
- Strong momentum candle
- Rising trading volume
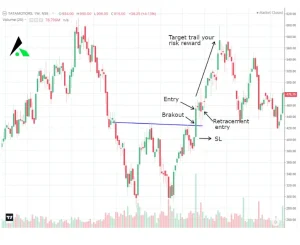
Breakout Entry Techniques
- Aggressive entry during breakout candle
- Conservative entry after retest
False breakouts are common, so confirmation is essential.
Real Breakouts vs Fake Breakouts
Real breakouts occur when price closes strongly beyond key levels with momentum and volume confirmation. Fake breakouts happen when the price briefly moves beyond a level before reversing sharply.
Recent trader discussions reveal that many markets in 2026 experience increased liquidity sweeps and false breakouts. Institutional algorithms frequently trigger retail stop losses before reversing direction.
This means traders must stop entering blindly on the first breakout candle. Waiting for confirmation and retests dramatically improves probabilities.
False Breakout Trading Strategy
One of the most profitable price action methods involves trapping emotional traders.
What Is a False Breakout?
A false breakout occurs when the price briefly breaks support or resistance before reversing sharply.
This creates:
- Liquidity grabs
- Stop-loss hunts
- Institutional accumulation
How to Trade False Breakouts
- Identify key support or resistance
- Wait for the breakout failure
- Confirm with a reversal candlestick
- Enter the opposite direction
False breakouts often produce explosive moves because trapped traders rush to exit positions.
Liquidity Sweeps Explained
Liquidity sweeps happen when the price intentionally moves beyond obvious highs or lows to trigger stop losses and attract breakout traders. Once enough liquidity enters the market, institutions reverse price aggressively.
Understanding liquidity is like understanding where crowds gather. Markets often move toward areas with concentrated stop losses because that’s where large players can execute orders efficiently.
Supply and Demand Trading Zones
Supply and demand zones represent areas where institutions previously entered large positions.
Supply Zone: A region where heavy selling caused a strong downward movement.
Demand Zone: A region where aggressive buying triggered sharp rallies.
Trading Supply and Demand
- Identify explosive price movements
- Mark the origin of the move
- Wait for the price return
- Look for rejection signals
These zones often outperform traditional support and resistance levels.
Multi-Timeframe Analysis Strategy
Professional traders never rely on a single timeframe.
How Multi-Timeframe Analysis Works?
- Higher Timeframe: Determines overall trend direction.
- Middle Timeframe: Identifies setups and structure.
- Lower Timeframe: Fine-tunes entries.
For example:
- The daily chart shows a bullish trend
- 4-hour chart reveals pullback
- The 15-minute chart provides an entry signal
This alignment dramatically improves trade probability.
Risk Management in Price Action Trading
Risk management separates gamblers from professionals. Even the best strategy fails without proper capital protection.
- Position Sizing: Position sizing determines how much capital you risk per trade. Most successful traders risk only 1% or less per setup. Studies consistently show disciplined risk management correlates strongly with long-term profitability. Small losses are manageable. Huge losses destroy accounts emotionally and financially.
- Stop Loss Placement: Stop losses should be placed logically beyond market structure, not randomly. Tight stops often get hit prematurely, while excessively wide stops destroy reward-to-risk ratios.
Smart traders place stops where the trade idea becomes invalid.
Psychology Behind Price Action Trading
Trading success depends heavily on emotional discipline.
Common Psychological Mistakes
- Revenge trading
- Overtrading
- Fear of missing out
- Moving stop losses
- Ignoring trade plans
Professional traders remain objective and patient.
Common Mistakes Price Action Traders Make
One major mistake is overtrading. Many traders believe more trades equal more profits. In reality, excessive trading usually increases emotional decision-making.
Another mistake is ignoring higher timeframe analysis. A bullish setup on the 5-minute chart may fail instantly if the daily trend remains strongly bearish.
Emotional revenge trading also destroys consistency. Traders who try to recover losses immediately often spiral into poor decisions. Reddit discussions and market studies repeatedly highlight emotional instability as a core reason traders fail.
Best Markets for Price Action Trading
Price action trading works across nearly every financial market. Forex remains popular because of liquidity and clean chart movement. Stocks provide strong trends during earnings seasons. Crypto markets offer volatility and breakout opportunities, though risk levels remain high.
Indices like the S&P 500 and Nifty 50 also respond exceptionally well to support, resistance, and trend continuation setups.
The key is specialisation. Traders who master one market often perform better than those jumping randomly between assets.
Best Timeframes for Price Action Trading
Different trading styles require different chart timeframes.
Scalping
- 1-minute
- 5-minute
Day Trading
- 15-minute
- 1-hour
Swing Trading
- 4-hour
- Daily
Higher timeframes generally produce stronger and more reliable signals.
How to Build a Complete Price Action Trading Plan?
A trading plan eliminates emotional decision-making.
Key Components of a Trading Plan
- Market selection
- Trading timeframe
- Entry criteria
- Exit strategy
- Risk management rules
- Daily trade limits
Consistency comes from structured execution.
How Professional Traders Use Price Action?
Professional traders focus on:
- Market structure
- Institutional behavior
- Liquidity
- Momentum
- Risk management
They avoid emotional reactions and maintain strict discipline.
The goal is not predicting every move but consistently exploiting high-probability opportunities.
Final Thoughts on Learn Powerful Price Action Trading Strategies
Price action trading provides a clear, adaptable, and highly effective framework for understanding financial markets. By mastering support and resistance, candlestick patterns, trend analysis, breakout setups, and risk management, traders can develop a professional-grade trading methodology.
Consistency in trading comes from disciplined execution, emotional control, and continuous market observation. The strategies outlined in this guide offer practical tools that can significantly improve market timing, trade precision, and long-term profitability.
Start focusing on clean charts, structured analysis, and high-quality setups. With dedication and experience, price action trading can become one of the most powerful skills in your trading journey.
FAQs
Is price action trading suitable for beginners?
Yes, price action trading is excellent for beginners because it simplifies chart analysis and focuses on core market behaviour instead of overwhelming indicators.
Which timeframe works best for price action trading?
Higher timeframes like the 4-hour and daily charts generally produce cleaner signals and fewer false setups compared to lower timeframes.
Can price action trading work without indicators?
Absolutely. Many professional traders use minimal or no indicators because price itself provides enough information about market sentiment and momentum.
How long does it take to master price action trading?
Mastery varies by individual, but consistent profitability often takes months or even years of disciplined practice and journaling.
What is the biggest mistake beginner traders make?
Overtrading and poor risk management remain the two biggest mistakes. Many traders focus too much on entries and ignore emotional discipline and capital protection.
Best Price Action Trading Book
You can read our book Price Action Trading: Beginner to Advanced to boost your trading knowledge. This book covers basic to advanced price action trading concepts, including trading strategies, candlestick patterns, chart patterns, technical analysis, volume analysis, risk management, and trading psychology. you can buy the book from Amazon or Flipkart.

