
In the world of trading, understanding market signals is crucial to making informed decisions. One of the most popular ways to analyze market trends is through candlestick patterns, which are visual representations of price movements within a specific period. Among these, bullish candlestick patterns are particularly valuable, as they indicate potential upward market reversals. Whether you’re a seasoned trader or just getting started, mastering these patterns can significantly enhance your trading strategy. In this comprehensive guide, we will explore the top 10 bullish candlestick patterns that every trader should know.
Understanding Bullish Candlestick Patterns
Candlestick patterns are a type of financial chart that originated in Japan over 100 years ago. They are used to describe the price movements of a security, derivative, or currency. Each candlestick on the chart represents a specific time frame, such as one day or one hour, and shows the opening, closing, high, and low prices during that period.
Importance of Bullish Candlestick Patterns in Trading
Bullish candlestick patterns are essential tools for traders because they signal the possibility of an upward price movement. Recognizing these patterns can help traders enter or exit positions at the most opportune times, maximizing profits and minimizing losses. They are especially useful in identifying market bottoms and predicting trend reversals.
How Bullish Patterns Indicate Market Trends
Bullish candlestick patterns typically form after a downtrend, signaling that buyers are gaining strength and that the market might be ready to reverse its direction. By learning to spot these patterns, traders can anticipate market movements and make more informed decisions.
Top 10 Bullish Candlestick Patterns
1. Hammer
The Hammer is one of the most reliable bullish candlestick patterns. It typically forms at the end of a downtrend and signals a potential reversal. The pattern is characterized by a small body at the upper end of the trading range with a long lower shadow, indicating that buyers have successfully countered selling pressure. When the Hammer forms after a significant downtrend, it often signals that the market may be bottoming out and a reversal is imminent.
Key Characteristics of the Hammer:
- Small real body located at the upper end of the trading range
- Long lower shadow, at least twice the length of the body
- Little or no upper shadow
Why the Hammer Signals a Bullish Reversal
The hammer pattern indicates that sellers drove the price down during the session, but by the end, buyers stepped in to push the price back up. This shift from selling to buying pressure often marks the beginning of an upward trend.
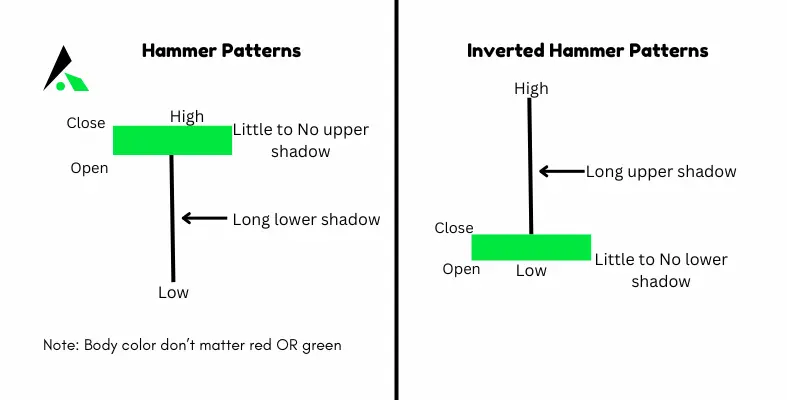
2. Inverted Hammer
The inverted hammer is similar to the regular hammer, but it is found at the end of a downtrend and has a long upper shadow instead of a lower one.
Key Characteristics of the Inverted Hammer:
- Small real body at the lower end of the trading range
- Long upper shadow, at least twice the length of the body
- Little or no lower shadow
When traders spot an inverted hammer, they may consider entering a long position, especially if the pattern is followed by a strong bullish confirmation, such as a gap up or a long green candlestick.
What Differentiates the Inverted Hammer from the Hammer
While the regular hammer has a long lower shadow, the inverted hammer’s long upper shadow suggests that buyers are beginning to gain control after a downtrend. This can be an early sign of a potential bullish reversal.
3. Bullish Engulfing Pattern
The Bullish Engulfing Pattern is a powerful reversal pattern that forms after a downtrend. It consists of two candlesticks: a small bearish candle followed by a larger bullish candle that completely engulfs the previous candle’s body. This pattern suggests that buying pressure has overwhelmed the sellers, leading to a potential reversal in the price trend.
Key Characteristics of the Bullish Engulfing Pattern:
- The first candle is bearish, followed by a larger bullish candle
- The second candle’s body completely engulfs the first candle’s body
- Occurs after a downtrend, signaling a potential reversal
When a bullish engulfing pattern forms, it suggests that buyers have overtaken the sellers, and a new uptrend may be on the horizon. Traders often see this as a strong signal to buy.
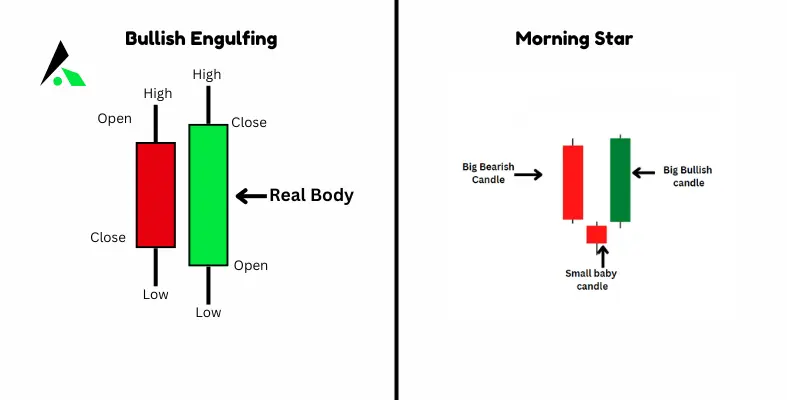
4. Morning Star
The Morning Star is a three-candle formation that signals the end of a downtrend and the beginning of an uptrend. It starts with a long bearish candle, followed by a small-bodied candle (which can be either bullish or bearish), and finally, a long bullish candle. The small-bodied candle represents indecision in the market, and the long bullish candle confirms the reversal.
Key Characteristics of the Morning Star:
- The first candle is long and bearish
- The second candle has a small body and may be bullish or bearish
- The third candle is a long bullish candle that closes above the midpoint of the first candle
Why the Morning Star is a Strong Bullish Signal
The morning star pattern shows a clear shift in market sentiment from bearish to bullish, making it a strong indicator that an upward trend is likely to follow.
5. Bullish Harami
The Bullish Harami is a two-candlestick pattern that signals a potential reversal in a downtrend. The pattern consists of a large bearish candle followed by a small bullish candle that is entirely contained within the body of the previous candle. The smaller second candle indicates a reduction in selling pressure and a possible shift towards a bullish trend.
Key Characteristics of the Bullish Harami:
- The first candle is a large bearish candle
- The second candle is a small bullish candle contained within the body of the first candle
- Occurs after a downtrend, signaling a potential reversal
How the Bullish Harami Reflects Market Sentiment
The bullish harami suggests that selling pressure is subsiding and that the market may be ready to reverse. It is particularly powerful when it occurs after a long downtrend.

6. Piercing Pattern
The Piercing Pattern is another bullish reversal pattern that occurs after a downtrend. It consists of two candlesticks: a long bearish candle followed by a long bullish candle. The bullish candle opens below the low of the bearish candle and closes more than halfway up the body of the bearish candle, indicating strong buying pressure.
Key Characteristics of the Piercing Pattern:
- The first candle is a long bearish candle
- The second candle is a bullish candle that opens below the low of the first candle
- The bullish candle closes more than halfway up the body of the bearish candle
The piercing line shows that the market is shifting from selling pressure to buying pressure. This change is often a sign that the downtrend is losing momentum and that a reversal could be imminent.
7. Bullish Kicker
The Bullish Kicker is a powerful reversal pattern that signals a dramatic shift in market sentiment. It consists of two candles: the first is a long bearish candle, and the second is a long bullish candle that opens at or above the previous candle’s open. This pattern indicates a sudden and strong reversal, often driven by unexpected news or events.
Key Characteristics of the Bullish Kicker:
- The first candle is a long bearish candle
- The second candle is a long bullish candle that opens at or above the previous candle’s open
- The pattern suggests a sudden shift in market sentiment

8. Dragonfly Doji
The dragonfly doji is a single-candlestick pattern that is often seen as a signal of an impending bullish reversal.
Characteristics of the Dragonfly Doji
- The opening, closing, and high prices are all at or near the same level.
- The candle has a long lower shadow.
Why the Dragonfly Doji is a Bullish Reversal Pattern
The dragonfly doji indicates that while there was significant selling pressure during the session, buyers were able to push the price back up to the opening level by the end of the session. This is often a sign that the market is about to turn bullish.
9. Three White Soldiers
The Three White Soldiers pattern is a strong bullish reversal signal that consists of three consecutive long bullish candles. Each candle opens within the previous candle’s body and closes near its high, indicating consistent buying pressure. This pattern is often seen after a downtrend and suggests a strong reversal is underway.
Key Characteristics of the Three White Soldiers:
- Three consecutive long bullish candles
- Each candle opens within the body of the previous candle
- Each candle closes near its high
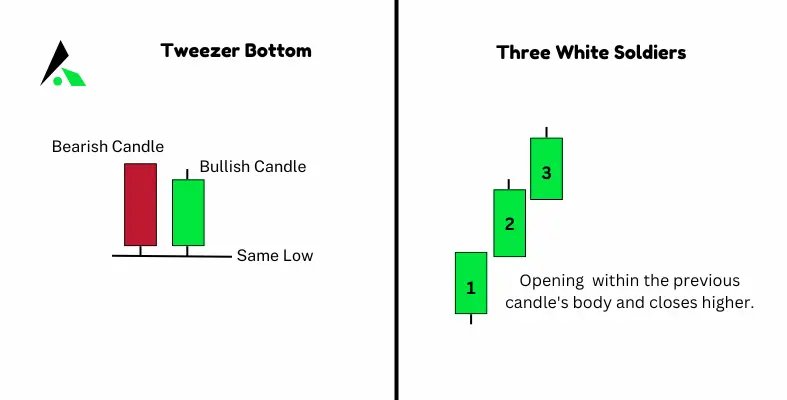
10. Tweezer Bottom
The Tweezer Bottom is a two-candle pattern that forms at the bottom of a downtrend and signals a potential reversal. It consists of two candles with similar lows, often indicating that the selling pressure has been exhausted. The first candle is bearish, and the second is bullish, confirming the reversal.
Key Characteristics of the Tweezer Bottom:
- The first candle is bearish, followed by a bullish candle
- Both candles have similar lows
- Occurs after a downtrend, signaling a potential reversal
Final Thought
Understanding and recognizing bullish candlestick patterns is crucial for any trader looking to capitalize on potential market reversals. These patterns provide valuable insights into market sentiment and can help traders make more informed decisions. By mastering these top 10 bullish candlestick patterns, you can enhance your trading strategy and increase your chances of success in the market.
Best Price Action Trading Book
You can read our book Price Action Trading Beginner to Advance to boost your trading knowledge. This book covers basic to advanced price action trading concepts, including trading strategies, candlestick patterns, chart patterns, technical analysis, volume analysis risk management, and trading psychology. you can buy the book from Amazon or Flipkart.
FAQs
Can Bullish Candlestick Patterns Guarantee Success in Trading?
No, while bullish candlestick patterns can provide strong indications of potential market movements, they do not guarantee success. It’s essential to use them in conjunction with other technical analysis tools and trading strategies.
How Often Do These Patterns Appear in the Market?
The frequency of these patterns can vary depending on the market and the time frame being analyzed. Some patterns, like the hammer or bullish engulfing, may appear more frequently, while others may be rarer.
Are There Any Limitations to Bullish Candlestick Patterns?
Yes, bullish candlestick patterns have limitations. They are most effective in trending markets and may produce false signals in choppy or sideways markets. It’s important to confirm these patterns with other indicators.
How Can I Learn to Identify These Patterns More Quickly?
Practice is key. The more you analyze charts and look for these patterns, the quicker you’ll become at spotting them. Using trading platforms that offer real-time data and pattern recognition tools can also help.
Do Bullish Candlestick Patterns Work in All Markets?
Bullish candlestick patterns can be applied to various markets, including stocks, forex, and commodities. However, their effectiveness may vary depending on market conditions and the specific asset being traded.

