Understanding candlestick patterns is an essential skill for traders seeking consistent profits in volatile markets. These patterns, derived from centuries-old Japanese charting techniques, provide a visual representation of price movements and market sentiment. Today, we’ll explore the Master candlestick pattern to boost trading success. By mastering these signals, traders can anticipate potential price reversals, identify trends, and make informed trading decisions.
What Are Candlestick Patterns?
Candlestick patterns are graphical representations of price action within a specified time frame. Each candlestick displays four key data points: open, high, low, and close prices. The body of the candlestick reflects the range between opening and closing prices, while the wicks (or shadows) show the highest and lowest traded prices during that period. A bullish candle typically appears green or white, indicating that the closing price is higher than the opening price. Conversely, a bearish candle is red or black, signaling that the closing price is lower than the opening price. Recognizing these elements is the foundation for interpreting patterns accurately.
Why Candlestick Patterns Matter
Think of candlesticks as the language of the market. Each candle shows who’s winning—the buyers or the sellers. Once you learn to “read” them, you’ll spot opportunities before many traders even react.
Brief History of Candlestick Charts
Candlestick charts were first developed in Japan in the 1700s by rice trader Munehisa Homma. Over time, this method spread worldwide, becoming a cornerstone of modern technical analysis.
Structure of a Candlestick
A candlestick shows four key price points: open, high, low, and close.
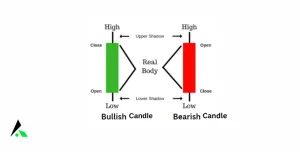
- The Body: The thick middle part shows the range between opening and closing prices.
- The Wick/Shadow: Thin lines above and below the body represent the highest and lowest prices during the timeframe.
- Open, High, Low, Close (OHLC): These define the candle’s entire story.
Importance of Candlestick Patterns in Trading
Mastering candlestick patterns empowers traders to:
- Predict Market Direction: Patterns often signal upcoming trend reversals or continuations.
- Enhance Entry and Exit Timing: Understanding these signals helps in selecting optimal trade setups.
- Manage Risk Effectively: Early detection of market shifts allows for better stop-loss placement.
By combining candlestick analysis with support and resistance levels, traders gain a clearer picture of market behavior, making their strategies more robust.
Types of Candlestick Patterns
Candlestick patterns fall into two main categories: bullish and bearish, with some indicating trend continuation and others signaling reversal.
1. Single Candlestick Patterns
Single-candle formations provide quick insights into potential market movements.
- Doji: Represents indecision as the open and close prices are nearly identical. It often signals a potential reversal after a strong trend.
- Hammer: A small body with a long lower shadow indicates strong buying pressure after sellers initially pushed prices down.
- Shooting Star: A small body with a long upper wick suggests selling pressure following a price rally.
2. Double Candlestick Patterns
Two-candle formations reveal more detailed market sentiment.
- Bullish Engulfing: A larger bullish candle completely engulfs the previous bearish candle, signaling potential upward momentum.
- Bearish Engulfing: A larger bearish candle swallows the prior bullish candle, indicating downward pressure.
- Tweezer Tops and Bottoms: Two consecutive candles with similar highs or lows suggest a possible trend reversal.
3. Triple Candlestick Patterns
Three-candle formations are powerful indicators of strong trend shifts.
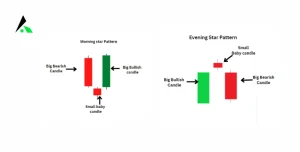
- Morning Star: A three-candle pattern indicating the end of a downtrend and the start of a bullish reversal.
- Evening Star: The opposite of Morning Star, signaling a potential bearish reversal.
- Three White Soldiers: Three consecutive long bullish candles point to strong buying interest and a continuation of the uptrend.
Key Candlestick Patterns Every Trader Must Know
Below are the most effective candlestick patterns for traders aiming for success:
Bullish Patterns
- Piercing Pattern: Appears in a downtrend when a bullish candle closes above the midpoint of the previous bearish candle, indicating a possible upward reversal.
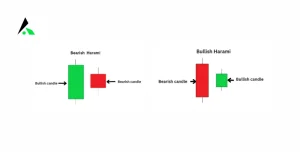
- Bullish Harami: A small bullish candle contained within a larger bearish candle suggests a slowdown in selling pressure.
Bearish Patterns
- Dark Cloud Cover: A bearish candle closes below the midpoint of the previous bullish candle, warning of a downward shift.
Bearish Harami: A small bearish candle within a large bullish candle signals weakening upward momentum.
Strategies for Trading with Candlestick Patterns
To maximize profitability, traders must combine candlestick analysis with other technical tools:
1. Confirm with Volume
High trading volume strengthens the validity of candlestick signals. For example, a bullish engulfing pattern with increased volume suggests stronger buying pressure.
2. Align with Market Trend
Always trade in the direction of the prevailing trend. Use moving averages to identify long-term trends and trade only when candlestick patterns align with these trends.
3. Integrate Support and Resistance
Patterns forming near support or resistance zones offer more reliable trade setups. A hammer at a major support level, for instance, provides a strong bullish signal.
4. Apply Risk Management
Set stop-loss orders just beyond the high or low of the candlestick pattern to minimize losses if the trade goes against you.
Common Mistakes to Avoid
While candlestick patterns are powerful, traders must avoid common pitfalls:
- Ignoring Confirmation: Entering trades without waiting for confirmation from subsequent price action can lead to false signals.
- Overtrading: Relying solely on patterns without considering market context increases risk.
- Neglecting Fundamental Analysis: Major economic events can override technical signals.
Advanced Tips for Candlestick Trading
- Combine with Indicators: Use RSI, MACD, or Bollinger Bands to validate candlestick signals.
- Focus on Higher Time Frames: Daily or weekly charts provide stronger and more reliable signals compared to intraday charts.
- Backtest Your Strategy: Analyze historical data to refine your candlestick-based trading approach before applying it in live markets.
Best Candlestick pattern Book
A Comprehensive Guide Candlestick Chart Patterns & Breakout Patterns is your ultimate roadmap to mastering technical analysis in trading. Designed for beginners and experienced traders alike, this book simplifies the art of reading candlestick patterns, recognizing breakouts, and making smarter trading decisions. With clear explanations, practical examples, and step-by-step guidance, you’ll learn how to identify trends, spot reversals, and capture profitable opportunities in stocks, forex, and crypto markets. Whether you’re day trading or investing long-term, this guide equips you with proven strategies and insights to boost confidence, reduce risks, and enhance consistency in your trading journey. you can buy the book from Amazon or Flipkart.
Final Thoughts
Candlestick pattern mastery is a vital skill for any trader aiming for consistent profits. By learning to identify key patterns, integrating them with technical tools, and applying disciplined risk management, traders can enhance their decision-making and improve their overall success rate.
FAQs on Master candlestick pattern to boost trading success?
How long does it take to master candlestick patterns?
It varies, but with daily practice, you can become proficient in a few months.
Are candlestick patterns reliable in all markets?
Yes, they work in stocks, forex, crypto, and commodities, but always confirm with other indicators.
Can beginners trade using only candlestick patterns?
It’s possible, but combining them with other tools improves success rates.
What’s the most powerful candlestick pattern?
The Engulfing pattern is widely respected for its reliability.
Do candlestick colors matter?
Yes. Typically, green (or white) shows price rise and red (or black) indicates a fall.

