

Who doesn’t dream of making ₹1000 daily from the comfort of their home? For many, intraday trading in the share market seems like the golden ticket. But is it possible? The short answer is—yes, but only if you’re disciplined, skilled, and patient. Intraday trading involves buying and selling stocks on the same day, aiming to profit from small price movements. Let’s explore How to Earn ₹1000 Per Day by Doing Intraday Trading in the share market.
How to Earn ₹1000 Per Day by Doing Intraday Trading?
What is Intraday Trading?
Intraday trading means buying and selling stocks on the same day, before the market closes. You profit from small price movements in stocks by leveraging speed and timing.
How does it work?
You enter a position when the market opens and exit it before 3:15 PM. No overnight holdings. This style is best suited for quick profits and active monitoring.
Start with the Right Capital
To earn ₹1000 per day consistently, the amount of capital you trade with plays a big role.
Recommended Capital: ₹30,000 to ₹50,000
With proper risk management and a 2%–3% profit target, you can realistically aim for ₹1000/day.
- Example: ₹50,000 × 2% = ₹1,000
- Avoid overtrading with small capital — it leads to over-leverage and high losses.
Choose the Right Stocks
Select stocks with high trading volume and price movement. Liquidity ensures easy entry and exit.
You need liquidity to enter and exit quickly.
Top Intraday Stocks:
- Reliance Industries
- HDFC Bank
- Tata Motors
- ICICI Bank
- Infosys
- SBI
Criteria for selection:
- Daily volume > 10 lakh shares
- Price movement > 2% per day
- Low bid-ask spread
Use a Proven Intraday Strategy
Intraday trading requires a disciplined and repeatable strategy. Here are 5 powerful strategies:
A. Breakout Strategy
Breakout Strategy is a trading method where traders enter a position when the price moves above resistance or below support with strong volume. This signals the start of a new trend.
For example:
- A bullish breakout happens when the price breaks above resistance.
- A bearish breakout occurs when the price falls below support.
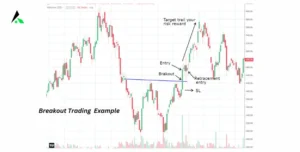
Traders use breakouts to catch big price movements early and set stop-losses to manage risk. Buy when the price breaks resistance with volume. Sell if it breaks support.
- Tools: Trendlines, support/resistance zones, volume spike
- Risk/Reward: Aim for a 1:2 ratio
B. Moving Average Crossover
Moving Average Crossover is a popular trading strategy that uses two different moving averages — one short-term and one long-term — to identify trend changes.
- A bullish crossover happens when the short-term moving average (e.g., 50-day) crosses above the long-term moving average (e.g., 200-day). This signals a potential buy opportunity.
- A bearish crossover occurs when the short-term average falls below the long-term, suggesting a sell signal.
C. Gap-Up/Gain Reversal
Gap-Up/Gain Reversal is a trading scenario where a stock opens significantly higher than its previous closing price (gap-up) but then reverses direction and falls during the trading session.
This indicates that the early bullish momentum couldn’t be sustained, often due to profit booking, weak fundamentals, or market sentiment. Traders use this pattern to identify potential short-selling opportunities or signs of a false breakout.
Trade stocks that gap up/down significantly. Enter when the price reverses with confirmation.
- Used during earnings season or news events
D. Support and Resistance Trading
Support and Resistance Trading is a strategy based on identifying key price levels on a chart. Support is the price level where a stock tends to stop falling due to buying interest. Resistance is where the price tends to stop rising due to selling pressure. Traders use these levels to predict price movements—buying near support and selling near resistance—to maximize profit and reduce risk.
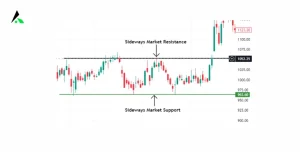
Trade the bounce near support or resistance. Great for range-bound stocks.
E. Volume-Based Trading
Volume-based trading is a strategy that uses the number of shares or contracts traded to make buy or sell decisions. High volume signals strong interest and confirms trends, while low volume may indicate weak momentum. Traders watch volume to identify breakouts, reversals, and market strength. It helps validate price movements and improves the accuracy of technical analysis in trading decisions.
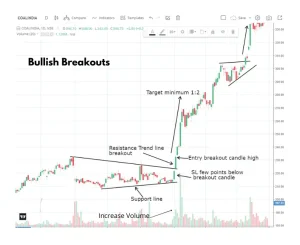
Spikes in volume often precede price movement. Learn to read it like a pro.
Risk Management is Crucial
This is the single most important rule. Never risk your entire capital.
- Risk per trade: Not more than 1%–2% of total capital
- Stop-loss: Mandatory for every trade
- Target: Always fixed – ideally twice the stop-loss
Example:
- Capital = ₹50,000
- Risk = 2% = ₹1000
- Trade setup: Stop-loss ₹5, Target ₹10
- Quantity = ₹1000 / ₹5 = 200 shares
If the trade hits the target, you earn ₹2000; if it fails, you lose ₹1000 — but you live to trade another day.
Use Proper Tools and Platforms
Modern trading platforms offer technical indicators, real-time charts, and order execution tools.
Best Trading Platforms in India:
- Zerodha Kite
- Upstox Pro
- Angel One
- ICICI Direct
- Fyers
Use tools like:
- Chartink (for screeners)
- TradingView (for charts)
- Sensibull (for option analysis)
Practice with Paper Trading First
Use Simulators Before Real Money: Apps like Sensibull or MoneyBhai let you simulate trades without risk. Build Confidence and Discipline: Practice your strategies. Mistakes in paper trading are free lessons.
Focus on Technical Analysis
Fundamentals matter for long-term investments. For intraday, technical indicators are king.
What is Technical Analysis?
Technical Analysis is a trading method used to evaluate stocks or other assets by analyzing price charts, patterns, and indicators. Instead of focusing on a company’s fundamentals, it studies past market data, especially price movements and trading volume, to predict future price trends. Common tools include:
- Candlestick patterns
- Moving averages
- Support and resistance
- RSI, MACD, and Bollinger Bands
Traders use technical analysis to identify entry and exit points and make informed trading decisions.
Top Indicators for Intraday Trading:
- Volume: Confirms strength of move
- Relative Strength Index (RSI): Overbought/oversold signals
- Moving Averages: Trend direction
- MACD: Trend strength and crossover signals
- VWAP: Institutional average price for the day
Avoid Overtrading
Don’t trade more just to hit the ₹1000 target. Focus on quality trades, not quantity.
- Max trades/day: 2–3 well-planned trades
- Overtrading leads to loss and emotional burnout
Trade Only in the Best Market Hours
Best Time for Intraday Trading:
- 9:15 AM to 11:30 AM: High volume and clean trends
- 2:00 PM to 3:00 PM: Possible trend reversals or continuation
Avoid trading during lunchtime (12–2 PM) due to low volume and choppiness.
Maintain a Trading Journal
Note date, time, stock, entry, exit, SL, reason for trade, and result.
Review Win/Loss Ratio and Risk Metrics: Even with a 50% win rate, good risk-reward can keep you profitable.
Keep Emotions Under Control
Trading is 80% psychology and 20% strategy.
- Don’t chase the market
- Accept losses gracefully
- Stick to your plan
- Take breaks after consecutive losses
Trading with a calm and focused mind leads to consistent profits.
Daily Routine of a Profitable Intraday Trader
- Pre-Market Analysis: Check news, global markets, and gap-ups/downs. Make your watchlist.
- Entry and Exit Discipline: Don’t enter randomly. Wait for confirmation from price action and indicators.
- Post-Market Review: Review your trades, journal them, and figure out what worked and what didn’t.
Realistic Path to ₹1000 Daily
| Capital | Risk % | Risk Amount | Target Profit (2x) | Daily Target |
| ₹25,000 | 2% | ₹500 | ₹1000 | ₹1000 |
| ₹50,000 | 2% | ₹1000 | ₹2000 | ₹1000 |
| ₹1,00,000 | 1% | ₹1000 | ₹2000 | ₹1000 |
The key is discipline, not doubling your money overnight.
Conclusion ON How to Earn ₹1000 Per Day by Doing Intraday Trading?
Earning ₹1000 per day in intraday trading is possible if you follow the right strategy, control your risk, and trade with discipline. It requires patience, consistent learning, and a structured approach, not luck. Start small, scale up slowly, and respect the process. Intraday trading is a business — treat it like one.
FAQs
How much capital do I need to earn ₹1000 per day in intraday trading?
Ideally, start with ₹25,000–₹50,000 and use proper risk management and leverage.
Is ₹1000/day a realistic goal for beginners?
Yes, but start small and build your skills. Even ₹200/day is a good start.
Which stocks are best for intraday trading?
Look for high-volume, liquid stocks like Reliance, HDFC Bank, ICICI Bank, Infosys, and SBI.
What’s the best time to trade intraday?
The first hour (9:15–10:30 AM) and the last hour (2:15–3:15 PM) usually offer the most volatility.
Is intraday trading safe?
It can be risky. But with proper knowledge, risk control, and discipline, it can be profitable and manageable.

