Intraday trading is a dynamic strategy that requires quick decision-making, in-depth analysis, and an understanding of market patterns. Candlestick patterns are indispensable tools for traders, providing clear visual cues to predict market movements. Below, we delve into the Top 10 Candlestick Patterns for intraday trading and their practical applications.
Basics of Candlestick Patterns
Candlestick patterns are a widely used tool in technical analysis, offering valuable insights into price movements in financial markets. Originating from Japanese rice traders in the 18th century, these patterns help traders identify market trends, potential reversals, and continuations. Understanding the basics of candlestick patterns is crucial for anyone looking to make informed trading decisions.
What Are Candlestick Patterns?
Candlestick patterns are visual representations of price movements during a specific time period. Each candlestick provides four key pieces of information:
- Open: The price at which the asset started trading during the period.
- Close: The price at which the asset finished trading during the period.
- High: The highest price reached during the period.
- Low: The lowest price reached during the period.
Structure of a Candlestick
A candlestick consists of two main parts:
Body: Represents the range between the opening and closing prices.
- If the close is higher than the open, the body is typically colored green or white (bullish).
- The body is usually red or black (bearish) if the close is lower than the open.
Shadows (Wicks): Vertical lines above and below the body, showing the high and low prices during the period.
Why Are Candlestick Patterns Important?
Candlestick patterns provide clear visual cues about market psychology and potential price direction. They help traders:
- Identify trends (uptrend, downtrend, or sideways).
- Predict potential reversals.
- Confirm trade setups when used alongside other technical indicators.
Benefits of Using Candlestick Patterns in Intraday Trading
- Quick Decision-Making: Candlestick patterns provide immediate visual cues.
- Clear Visual Representation: They simplify complex price data.
- Trend Identification: Whether a trend is reversing or continuing, candlestick patterns help traders act accordingly.
How to Use Candlestick Patterns in Trading?
Identify the Trend
Before relying on candlestick patterns, determine the prevailing market trend. Patterns are most effective when analyzed in the context of ongoing trends, whether bullish, bearish, or sideways.
Look for Confirmation Signals
Do not trade solely based on a single candlestick pattern. Use confirmation signals such as volume analysis, moving averages, or support and resistance levels to strengthen your trade setup.
Combine with Technical Indicators
Enhance accuracy by combining candlestick patterns with indicators such as:
- Relative Strength Index (RSI): Identifies overbought or oversold conditions.
- Moving Averages: Determines trend direction and potential reversal points.
- Bollinger Bands: Helps spot volatility and price breakouts.
Set Stop-Loss and Take-Profit Levels
Manage risk by setting stop-loss orders below support levels for bullish trades and above resistance levels for bearish trades. Take-profit levels should be based on key resistance/support zones or previous price action.
Volume is Key: High trading volume often validates the reliability of a pattern.
Practice with a Demo Account
Before applying candlestick patterns in live trading, practice on a demo account to build confidence and refine your strategy without risking real money.
Candlestick patterns are a powerful tool in trading, offering insights into market sentiment and potential price movements. However, they should not be used in isolation. Combining them with trend analysis, technical indicators, and risk management strategies will improve your trading accuracy and profitability. With practice and discipline, traders can effectively use candlestick patterns to make informed trading decisions.
Top 10 Candlestick Patterns for Intraday Trading
1. Doji Candlestick Pattern
The Doji pattern signifies market indecision, which occurs when the opening and closing prices are nearly identical. A Doji candle often acts as a precursor to a market reversal.
Types of Doji:-
- Neutral Doji: Signals equilibrium.
- Dragonfly Doji: Indicates bullish sentiment.
- Gravestone Doji: Reflects bearish sentiment.
Note: Spot potential reversals during trend exhaustion. Confirm with volume or subsequent price action.
2. Hammer and Inverted Hammer
The Hammer indicates a potential bullish reversal, characterized by a small body at the top and a long lower shadow. Conversely, the Inverted Hammer suggests bullish reversals in downtrends.
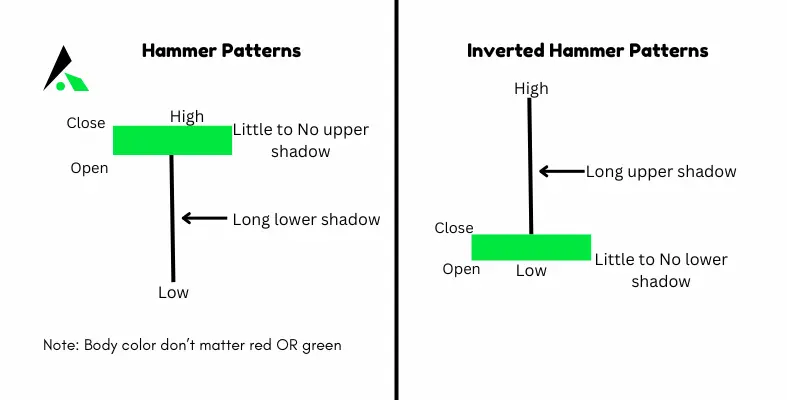
Key Features:
- Found in downtrends.
- Long lower shadow shows rejection of lower prices.
Note: Look for confirmation with the next bullish candle.
3. Shooting Star
The Shooting Star is a bearish reversal pattern. It has a small body near the low and a long upper shadow.
Characteristics:
- Appears after an uptrend.
- Long upper shadow signals a rejection of higher prices.
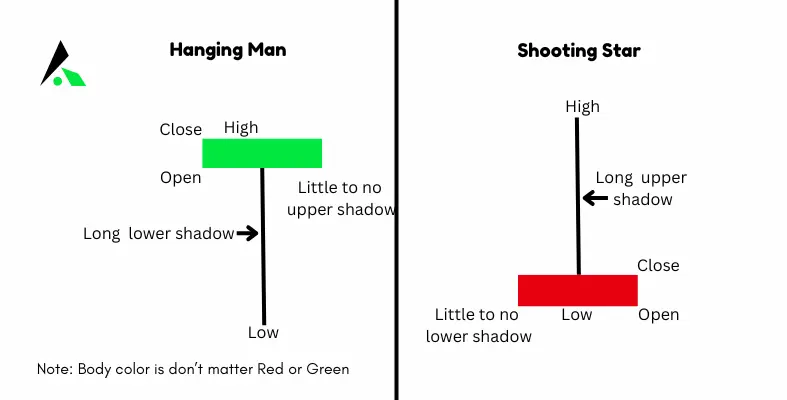
Strategy: Use resistance levels to confirm reversal.
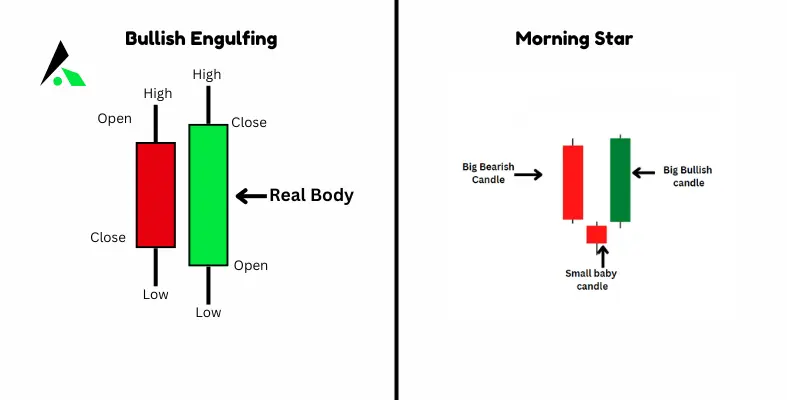
4. Bullish and Bearish Engulfing Patterns
Engulfing patterns show strong momentum in the direction of the engulfing candle.
- Bullish Engulfing: A small bearish candle followed by a large bullish candle.
- Bearish Engulfing: A small bullish candle followed by a larger bearish one.
Note: Engulfing patterns signal strong reversals and are reliable when accompanied by high volume.
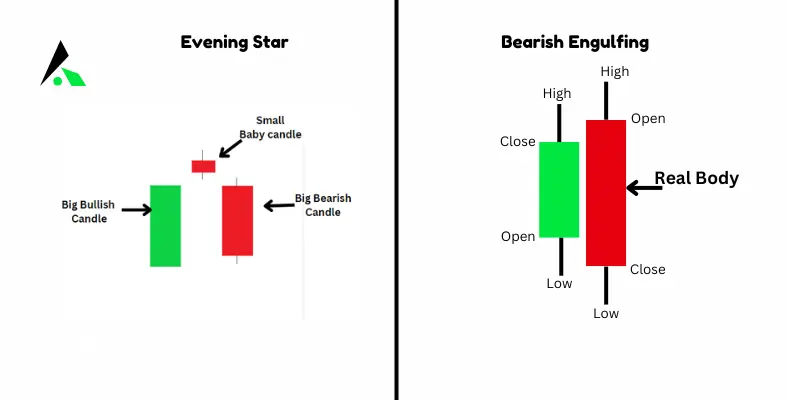
5. Morning Star and Evening Star
These are three-candle patterns indicating reversals.
- Morning Star: A bullish reversal pattern appears at the end of a downtrend.
- Evening Star: A bearish reversal pattern forming at the top of an uptrend.
Structure:
- The first candle follows the trend.
- The second candle shows indecision.
- The third candle reverses the trend.
6. Harami Patterns (Bullish and Bearish)
The Harami pattern is a two-candle formation where the second candle is entirely contained within the first.
- Bullish Harami: Appears in a downtrend and signals reversal.
- Bearish Harami: Occurs in an uptrend and indicates a bearish shift.
Insights: Look for reduced volume during the second candle for reliability.
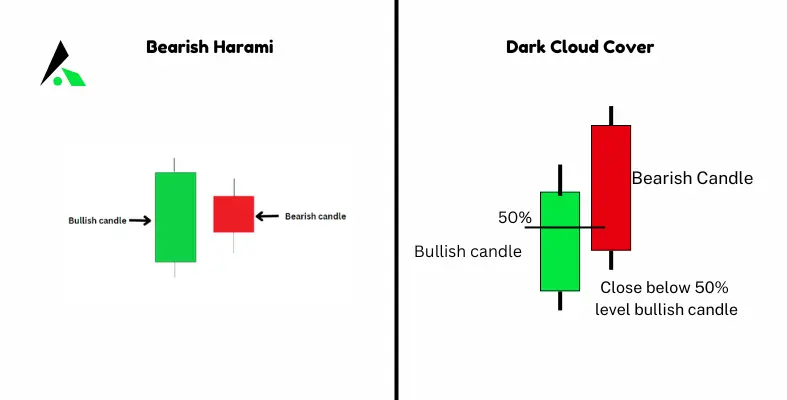
7. Piercing Line and Dark Cloud Cover
These patterns indicate significant trend reversals.
- Piercing Line: A bullish reversal pattern where a bullish candle closes above the midpoint of the preceding bearish candle.
- Dark Cloud Cover: A bearish reversal pattern where a bearish candle closes below the midpoint of the previous bullish candle.
8. Tweezer Tops and Tweezer Bottoms
These two-candle patterns are strong indicators of reversals.
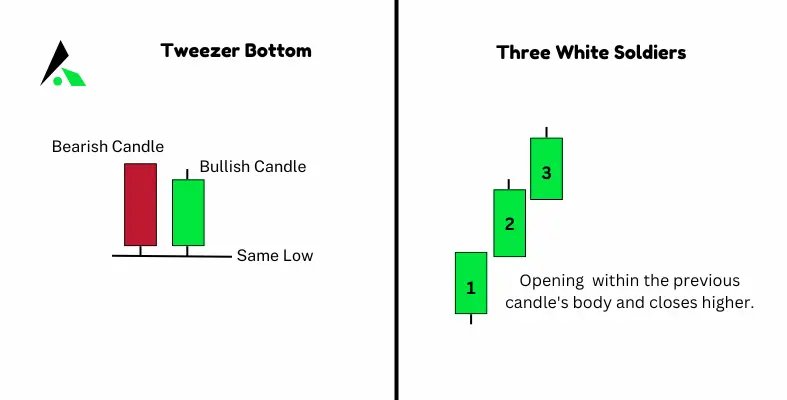
- Tweezer Tops: Indicate bearish reversals after an uptrend.
- Tweezer Bottoms: Suggest bullish reversals after a downtrend.
9. Marubozu Candlestick
The Marubozu candle lacks shadows and is a clear indicator of strong momentum.
- Bullish Marubozu: Signals a strong upward movement.
- Bearish Marubozu: Indicates a powerful downward move.
Usage: Confirm with trend strength indicators like ADX.
10. Three White Soldiers and Three Black Crows
These patterns signal strong directional movement over three consecutive sessions.
- Three White Soldiers: Three long bullish candles indicate a strong uptrend.
- Three Black Crows: Three long bearish candles signal a powerful downtrend.
Note: Watch for high volume to validate the trend strength.
Tips for Using Candlestick Patterns in Intraday Trading
- Combine Patterns with Indicators: Use RSI, MACD, or Bollinger Bands for confirmation.
- Focus on Timeframes: Intraday traders should prioritize 5-minute, 15-minute, or hourly charts.
- Mind Volume: High volume adds reliability to patterns.
- Avoid Overtrading: Only act on patterns that align with your trading plan.
- Test Strategies: Use demo accounts to refine candlestick strategies before live trading.
Best Price Action Trading Book
You can read our book Price Action Trading Beginner to Advance to boost your trading knowledge. This book covers basic to advanced price action trading concepts, including trading strategies, candlestick patterns, chart patterns, technical analysis, volume analysis risk management, and trading psychology. you can buy the book from Amazon or Flipkart.
Final Thought
Mastering candlestick patterns is a stepping stone to becoming a successful trader. By combining these patterns with a sound trading strategy and discipline, traders can navigate the markets more effectively. Remember, consistency and discipline are keys to success.
FAQs
What is the best candlestick pattern for beginners?
Start with simple patterns like the hammer or Doji.
How reliable are candlestick patterns in intraday trading?
They’re reliable when combined with other indicators and context.
How to read candles?
Reading candlestick charts involves analyzing the open, high, low, and close prices of an asset. A bullish candle (green/white) means the closing price is higher than the opening price, signaling buying pressure. A bearish candle (red/black) indicates selling pressure. Wicks show price extremes. Recognizing patterns like Doji, Engulfing, and Hammer helps predict market movements effectively.
Can I combine candlestick patterns with other strategies?
Absolutely! Use tools like moving averages and RSI for confirmation.
How do I confirm a candlestick pattern before trading?
Look at volume, trend direction, and additional indicators.
What is the 5 candle rule?
The 5 Candle Rule helps traders confirm trend reversals or continuations. It suggests waiting for five consecutive candles in the same direction before entering a trade, reducing false signals.
What tools can I use to analyze candlestick patterns?
Platforms like TradingView and MetaTrader offer excellent tools for analysis.
Which candlestick pattern is best?
The best candlestick pattern depends on the market situation. However, the Engulfing Pattern, Hammer, and Morning Star are highly reliable for trend reversals, while Three White Soldiers and Three Black Crows indicate strong trend continuation. Always confirm patterns with technical indicators and market context before trading.
How to learn candlestick pattern for beginners?
Beginners can learn candlestick patterns by studying their structures, meanings, and market implications. Start with basic patterns like Doji and Hammer, use demo trading for practice, and analyze historical charts for better understanding.

