Trendlines are a crucial tool in technical analysis, helping traders and investors identify trends and make informed decisions about the market. In this comprehensive guide, we will delve into What It Is, How To Use It in Trading, How To Draw Trendlines. and how to leverage them effectively in your trading strategies. Trend lines are straight lines that connect two or more price points on a chart to identify and confirm trends.
In technical analysis, trendlines serve as a fundamental analysis that traders and analysts utilize to recognize and predict the overall pattern of market price movements. Essentially, they visually represent levels of support and resistance across different time frames.
What Is a Trendline?
Trend lines are a technical analysis tool used in trading to identify the direction and strength of a trend. They are drawn by connecting a series of highs or lows on a chart and can help traders make informed decisions about buying or selling.
Technical traders rely extensively on trend lines for technical analysis. They center their Trading strategy around trends and the underlying factors behind them instead of fundamentals and past performance.
Types of Trendlines
There are primarily three types of stock trend lines. They are uptrend lines and downtrend lines.
1. Uptrend line:
The uptrend line is also called the ascending trend line. When the lows are connected, an ascending trend line is formed. The higher point in the line represents the recent low price and the lower point represents the previous low price.
As an uptrend line extends in the future, it can be regarded as a level of support positive slope in ascending lines that support price actions indicating that demand is increasing, i.e. the number of buyers exceeds the number of sellers.
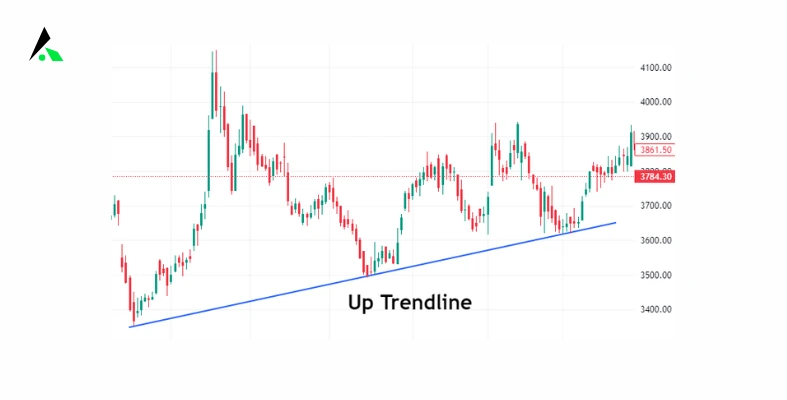
If the price action is above this line, the trend will be bullish.
2.Downtrend line:
A downtrend line is the opposite of an uptrend line. The descending trend line is formed when the high points are connected. Here, the previous high is placed higher than the more recent high. It also extends in the future and is regarded as a level of resistance. A downtrend line that has a negative slope and acts as a resistance to price action indicates that supply is increasing, i.e. the number of sellers exceeds the number of buyers. If the price action continually falls under the line, it shows a bearish trend.
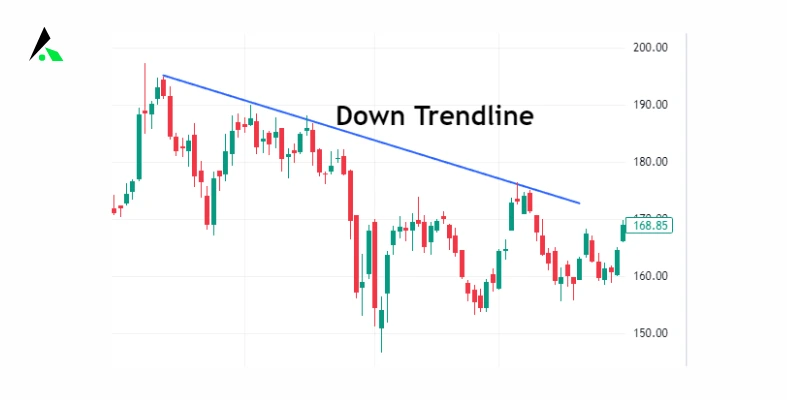
If the price action is below this line, the trend will be bearish.
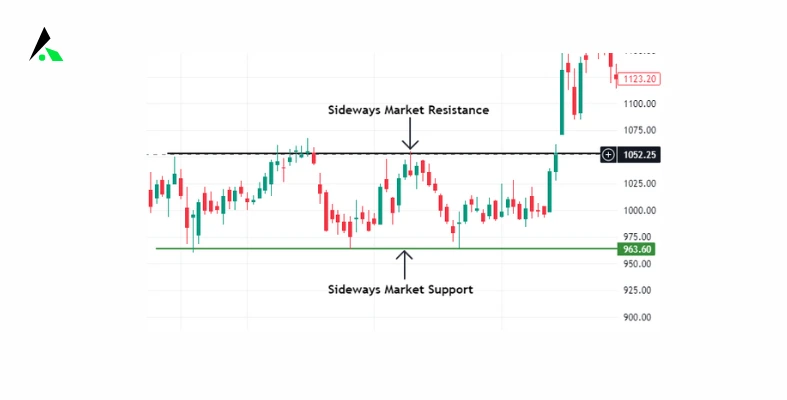
3. Sideways trend:
A sideways market, or horizontal trend, is a market phase where price rises and falls within a particular range. The sideways trend occurs as a result of the equal demand and supply forces in the market for a specific time. A sideways market aims to consolidate and move in a narrow range without showing a clear trend in either direction.
How to draw a trendline correctly?
Trendlines represent one of the most popular tools of technical analysis. Don’t disregard this instrument in favor of more complicated tools, as trendlines can be very helpful for your trading. The main benefit of drawing trendlines is that they make the picture on the chart clearer. To succeed in trading, you should be able to find useful information on the chart, separate it from the useless info, and project it to the future. Analyzing the trendline will help to find other formations and, consequently, make the right trading decisions.
It’s possible to draw many trendlines on one chart, but too many lines will confuse you. The goal is to choose the most evident lines and draw them. If a trendline is obvious, then many traders, including large speculators, will notice it. As a result, the odds that such a line will hold the movement of a currency pair are higher.
A trendline has 2 characteristics:
- Minimum 2 intersections with the price.
- Bias (the line is not horizontal).
The more times the price touches the trendline, the stronger is this trend. Pay attention to the angle of the trendline. If it’s less than 30 degrees, the trend is too steep and unstable. It’s better when the trend’s angle exceeds 45 degrees. In other words, the second point through which we draw the trendline should be 25-35 candles away from the first one. Trendlines may be used on any timeframe, but it’s better if the chart period is greater than M15.
How Does a Trendline Work?
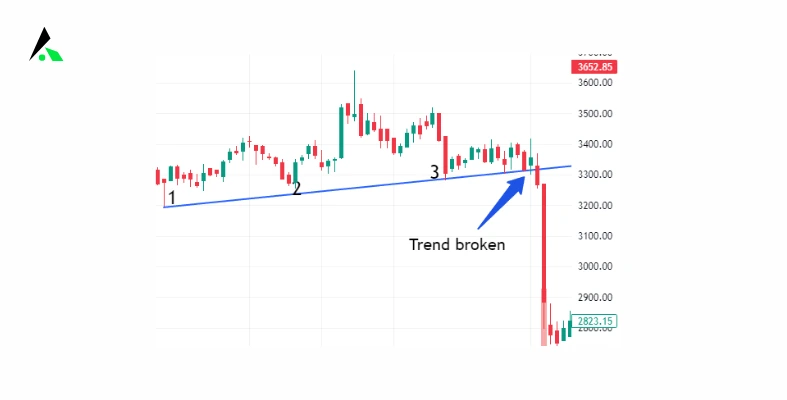
By drawing a trend line connecting points 1 and 2, we can then extend the trend line to the ‘infinite.’ Understand? As we learned from the Dow Theory, once a trend is started it continues. Yes, it does until something happens and causes the stock to change its direction and start a new trend.
So by looking at the above chart, we see that the trend line starting at support point 1, and extended past (support) point 2 gives us a good idea as to where the stock might find support during any pullbacks in price. As the chart clearly shows, that is what happened when the stock eventually traded higher and pulled back to find support right along the trend line.
The idea here, as you can see, is that this trend line is extended and continues to follow the stock.
This trend line creates buy (entry) points to purchase the stock. This is a great tool to use when considering trading or investing in a stock and looking for a place to enter. An advancing stock will pull back and usually find support very close to the trend line. That becomes a good entry point for a couple of reasons:
1) The trend line itself serves are minor support.
2) The stock has pulled back from a high and as it reaches the trend line, it is normally not that far from the previous low. This allows you to enter a position and place a stop loss just under the previous low. This limits any possible loss in case the stock turns and trades lower instead of advancing as you anticipate.
Features of Trend Lines
It is easier to recognize trend lines because of their visual position. Additionally, they also have several other features that make them easy to identify and use. They are below:
Diagonally Inclined: Trend lines have slopes because they are always inclined at an angle and either faces downward or upward.
Slopes: The steepness of the slopes in trend lines varies according to the angle at which they are drawn. In general, steeper slopes depict stronger trends and gentler slopes show weaker trends.
Dynamic Resistance and Support: Trend lines are natural dynamic lines that depict the support and resistance zones. They change as the market changes and show changing resistance and support prices.
Trend channels
Sometimes you can clone and move the trendline so that the cloned line is parallel to the first one and limits the trend from the other side so that one line goes through the pair’s highs and the other one connects its lows. This is called a trend channel.
Note that the main line during an uptrend is the one that connects the lows (support line), while in a downtrend the focus is on the line, which connects the price’s highs (resistance line). Channels help traders to orient themselves inside the trend.
You can read our book Price Action Trading Beginner to Advance to boost your trading knowledge. This book covers basic to advanced price action trading concepts, including trading strategies, candlestick patterns, chart patterns, technical analysis, volume analysis risk management, and trading psychology. you can buy the book from Amazon or Flipkart.
The Difference Between Trendlines and Channels
More than one trendline can be applied to a chart. Traders often use a trendline connecting highs for a period as well as another to connect lows into rate channels. A channel adds a visual representation of both support and resistance for the period being analyzed. Similar to a single trendline, traders are looking for a spike or a breakout to take the price action out of the channel. They may use that breach as an exit point or an entry point depending on how they are setting up their trade.
Conclusion
There are 3 types of trends in the stock market. They are uptrend, downtrend, and sideways trend. Drawing trendlines helps traders to make quick trading decisions based on what is prevalent in the market. However, they must exercise caution and not force trendlines to fit the market to avoid poor trading decisions.
FAQs:
What Are Stock Trendlines Used for?
Trendlines are used by technical analysts to predict the direction of a stock or other financial security. Armed with a clearer sense of potential direction, analysts can then make better decisions about stock trades.
What should traders do when a trend line breaks?
A break in a trend line serves as a warning that a change in trend may be imminent. However, this should not be the final deciding factor. Traders should also look at other confirming signals, like horizontal support and resistance levels or peak-and-trough analysis, for a potential change in trend.
How does the angle of a trend line affect its validity?
The steeper the trend line, the lesser its validity as a support or resistance level. Steep trend lines often result from sharp advances or declines over a brief period. These lines may not offer meaningful support or resistance levels even if they are formed with three seemingly valid points.
Which trendline is best?
Best trendline it depends on the context and market conditions. Traders commonly use upward-sloping trendlines for uptrends and downward-sloping ones for downtrends. Horizontal trendlines indicate consolidation. The key is selecting a trendline that aligns with the market’s current direction to make more accurate predictions and informed trading decisions.
How do you find a strong trend?
Identifying a strong trend involves assessing price movement and momentum. Look for a consistent directional move with minimal retracements. Analyze higher highs and higher lows in an uptrend, or lower highs and lower lows in a downtrend. Strong trends often accompany increased trading volume, indicating widespread market participation. Technical indicators like moving averages or trendlines can help confirm and quantify the strength of a trend.
What is trendline for uptrend?
In an uptrend, a trendline is drawn by connecting the successive higher lows on a price chart. It visually represents the rising support level and helps identify the overall upward trajectory of the market. This upward-sloping line serves as a guide for traders, indicating the direction of the prevailing trend and potential entry points for long positions as the market continues to make higher highs and higher lows.

