
In the world of financial markets, understanding candlestick patterns is akin to deciphering a unique language that holds the key to successful trading. These patterns offer traders valuable insights into market sentiment and potential price movements.
In this comprehensive guide, we will delve into the world of candlestick patterns and charts, equipping you with the knowledge to make informed trading decisions. Let’s delve into the heart of this subject
Candlestick Patterns and Charts
What are Candlestick Charts Patterns?
Candlestick charts have a rich history that dates back to 18th century Japan. Munehisa Homma, a Japanese rice merchant, developed this unique method to track the price movement of rice in the Ojima Rice market. The charting method, initially known as “candlestick rice charts,” eventually made its way to the Western world.
Understanding the basic structure of a candlestick is fundamental. Each candlestick represents a specific time frame, whether a minute, an hour, a day, or longer. Here’s a breakdown of its components.
It has three basic features:
- The body, which represents the open-to-close range
- The wick, or shadow, that indicates the intra-day high and low
- The color, which reveals the direction of market movement- a green (or white) body indicates a price increase, while a red (or black) body shows a price decrease.

Candlestick patterns emerge from the combination of these basic components, and they can provide critical insights into market sentiment and potential price movements.
Type of Candlestick Patterns?
Candlestick charts are an excellent way of understanding investor sentiment and the relationship between demand and supply, bears and bulls, greed and fear, etc.
Traders must remember that while an individual candle provides sufficient information, patterns can be determined only by comparing one candle with its preceding and next candles. To benefit from them, it is important that traders understand patterns in candlestick charts.
For better understanding let’s divide the patterns into three sections:
- Bullish patterns
- Bearish patterns
- Continuation Patterns
Top 8 Bullish Candlestick Patterns
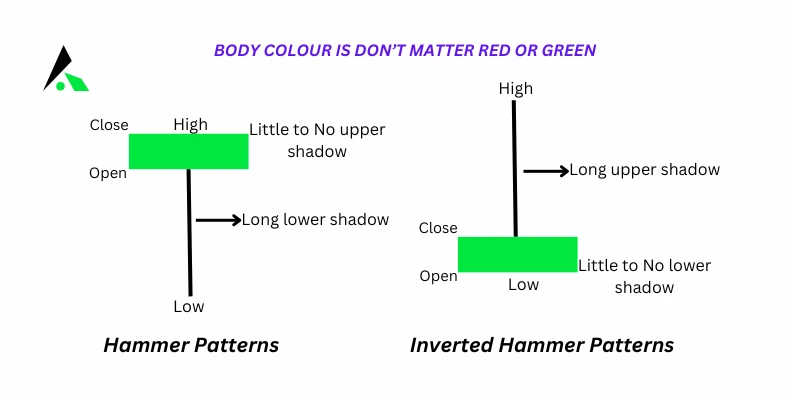
- Hammer: This is a candle with a short body and a long lower wick. It is usually located at the bottom of a downward trend. It indicates that despite selling pressures, a strong buying surge pushed the prices up. If the body is green, it indicates a stronger bull market than a red body.
- Inverse Hammer Pattern: The only difference is that the upper wick is long, while the lower wick is short. It indicates a buying pressure, followed by a selling pressure that was not strong enough to drive the market price down. The inverse hammer suggests that buyers will soon have control of the market.
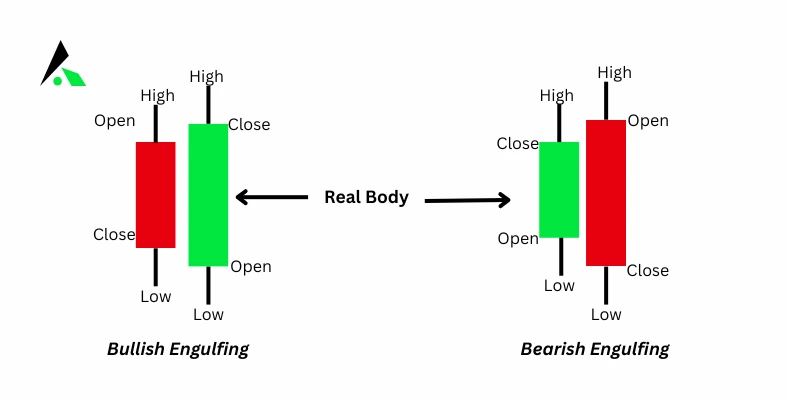
- Bullish Engulfing Pattern: This is a pattern of two candlesticks where the first candle is a short red one engulfed by a large green candle. It indicates a bullish market that pushes the price up despite opening lower than the previous day.
- Piercing Line Pattern: The piercing line is also a two-stick pattern, made up of a long red candle, followed by a long green candle. There is usually a significant gap between the first candlestick’s closing price and the green candlestick’s opening. It indicates a strong buying pressure, as the price is pushed up to or above the mid-price of the previous day.
- Morning Star Pattern: The morning star candlestick pattern is considered a sign of hope in a break market downtrend. It is a three-stick pattern: one short-bodied candle between a long red and a long green. Traditionally, the ‘star’ will have no overlap with the longer bodies, as the market gaps both open and close. It signals that the selling pressure of the first day is subsiding, and a bull market is on the horizon.

- Three White Soldiers Pattern: This is a three-candle pattern that has three green candles with small wicks. These candles open and close higher than the previous day. After a downtrend, this is a strong indication of an upcoming bull trend.
- Bullish Harami Candlestick Pattern: The Bullish Harami is a candlestick chart pattern in which a large candlestick is followed by a smaller candlestick whose body is located within the vertical range of the larger body candle on the previous day. In terms of candlestick colors, the bullish harami is a downtrend of negative-colored candlesticks engulfing a small positive (white) candlestick, giving a sign of a reversal of the downward trend.

- White Marubozu: The White Marubozu is a single candlestick pattern that is formed after a downtrend indicating a bullish reversal. this candlestick has a long bullish body with no upper or lower shadows which shows that the bulls are exerting buying pressure and the markets may turn bullish.
At the formation of this candle, the sellers should be cautious and close their shorting position.
Top 8 Bearish Candlestick Patterns
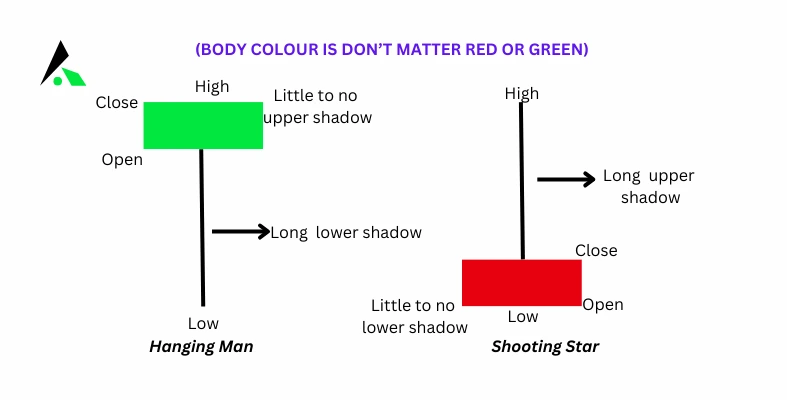
- Hanging Man Pattern: The hanging man is the bearish equivalent of a hammer; it has the same shape but forms at the end of an uptrend. It indicates that there was a significant sell-off during the day, but that buyers were able to push the price up again. The large sell-off is often seen as an indication that the bulls are losing control of the market.
- Shooting Star Pattern: This is a candle with a short body and a long upper wick. It is usually located at the top of an upward trend too. Usually, the market opens higher than the previous day and rallies a bit before crashing like a shooting star. It indicates selling pressure taking over the market.
- Bearish Engulfing Pattern: A bearish engulfing pattern occurs at the end of an uptrend. The first candle has a small green body that is engulfed by a subsequent long red candle. It signifies a peak or slowdown of price movement and is a sign of an impending market downturn. The lower the second candle goes, the more significant the trend is likely to be. Thus, it is simply the opposite of the Bullish Engulfing pattern. It forms after an advancing trend and signals that a reversal is about to take place. When you see the Bearish Engulfing pattern form after a stock has been trending up, then there is a pretty clear signal that a change in direction is in the air.
- Evening Star Pattern: This is a three-candle pattern that has one candle with a short body between one long red and a long green candle. There is usually no overlap between the short and the long candles. This is an indication of the reversal of an upward trend. This is more significant if the third candle overcomes the gains of the first candle.
- Three Black Crows Pattern: The three black crows candlestick pattern comprises of three consecutive long red candles with short or non-existent wicks. Each session opens at a similar price to the previous day, but selling pressures push the price lower and lower with each close. Traders interpret this pattern as the start of a bearish downtrend, as the sellers have overtaken the buyers during three successive trading days.
- Dark Cloud Cover: The dark cloud cover candlestick pattern indicates a bearish reversal- a black cloud over the previous day’s optimism. It comprises two candlesticks: a red candlestick that opens above the previous green body and closes below its midpoint. It signals that the bears have taken over the session, pushing the price sharply lower. If the wicks of the candles are short it suggests that the downtrend was extremely decisive.
- The Bearish Harami: The Bearish Harami is a pattern that forms at the top after an advance. It is indicated by a large dark candlestick that forms on a negative trading day signaling a change may be in store. Then it is followed by a much smaller candlestick with a body that is located within the vertical range of the larger candle’s body.
- Black Marubozu: The Black Marubozu is a single candlestick pattern that is formed after an uptrend indicating a bearish reversal.
This candlestick chart has a long bearish body with no upper or lower shadows which shows that the bears are exerting selling pressure and the markets may turn bearish.
At the formation of this candle, the buyers should be cautious and close their buying position.
Top 8 Continuation Candlestick Patterns
- Doji: The Doji pattern is a price action candlestick pattern of indecision that is formed when the opening and closing prices are almost equal.
It is formed when both the bulls and bears are fighting to control prices but nobody succeeds in gaining full control of the prices. The candlestick pattern looks like a cross with a very small real body and long shadows.

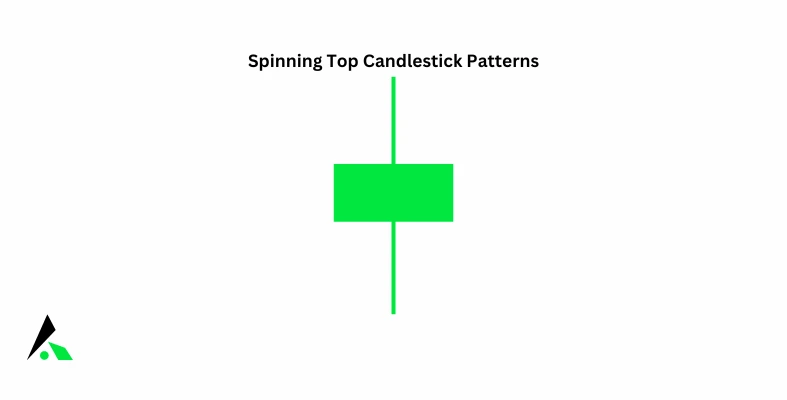
- Spinning Top: The spinning top candlestick pattern is the same as the Doji indicating indecision in the market.
The only difference between the spinning top and the doji is in their formation, the real body of the spinning is larger as compared to the Doji.
- Rising Three Methods: The “rising three methods” is a bullish, five-candle continuation pattern that signals an interruption, but not a reversal, of the ongoing uptrend.

The candlestick pattern is made of two long candlesticks in the direction of the trend i.e. uptrend in this case. at the beginning and end, with three shorter counter-trend candlesticks in the middle. The candlestick pattern is important as it shows traders that the bears still do not have enough power to reverse the trend.
- Falling Three Methods: The “falling three methods” is a bearish, five-candle continuation pattern that signals an interruption, but not a reversal, of the ongoing downtrend.

The candlestick pattern is made of two long candlestick charts in the direction of the trend i.e. downtrend at the beginning and end, with three shorter counter-trend candlesticks in the middle. The candlestick pattern is important as it shows traders that the bulls still do not have enough power to reverse the trend.
- Upside Tasuki Gap: It is a bullish continuation candlestick pattern that is formed in an ongoing uptrend.
This candlestick pattern consists of three candles, the first candlestick is a long-bodied bullish candlestick, and the second candlestick is also a bullish candlestick chart formed after a gap up.
The third candlestick is a bearish candle that closes in the gap formed between these first two bullish candle.

- Downside Tasuki Gap: It is a bearish continuation candlestick pattern that is formed in an ongoing downtrend.
This candlestick pattern consists of three candles, the first candlestick is a long-bodied bearish candlestick, and the second candlestick is also a bearish candlestick formed after a gap down.
The third candlestick is a bullish candle that closes in the gap formed between these first two bearish candles.

How to Use Candlestick Patterns?
Candlestick patterns are valuable tools for traders. They help in identifying potential entry and exit points in the market. Here’s how you can make the most of them.
- Confirmation: Using candlestick patterns in conjunction with other technical indicators and analysis is crucial. Combining these tools can provide a more comprehensive view of the market.
- Risk Management: Never rely solely on a single candlestick pattern. Be sure to set stop-loss orders to mitigate potential losses.
- Timeframes: Different patterns are more effective on specific timeframes. For example, day traders often focus on shorter timeframes, while long-term investors may pay more attention to daily or weekly charts.
- Practice: As with any skill, practice is key to mastering the art of reading candlestick charts. Demo accounts and paper Trading can be excellent ways to hone your skills without risking real capital.
Conclusion:
Understanding basic candlestick patterns and charts is a fundamental skill for anyone involved in financial markets. These visual representations of price movements can provide critical insights into market sentiment and potential price trends. By mastering the art of reading candlestick charts and recognizing common patterns, you can make more informed decisions and improve your trading strategies.
Best Price Action Trading Beginner to Advance Book .you can buy the book from Amazon or Flipkart.
FAQs:
Do chart patterns work in all financial markets?
Yes. Patterns can be identified in any financial market, but their reliability differs due to market players, volatility, timeframe, and trading strategy. This is why it’s important to backtest your strategy on historical data and find out which markets are performing the best based on your trading rules.
Can candlestick patterns be used independently for stock selection?
Candlestick patterns are best used in combination with other measures of technical analysis. This helps in covering all aspects while analysing a stock to ultimately make an informed investment decision.
Can technical analysis be used to find undervalued stocks?
Yes, you can use a combination of both fundamental and Technical analysis to identify undervalued stocks. While fundamental analysis tells you about the company and its industry, technical analysis helps in evaluating the fair value of an undervalued stock.
How do you read a candle chart?
Candlestick charts display price movements in financial markets. Each “candle” represents a specific time period. The body shows the opening and closing prices, with colors indicating gains (green) or losses (red). Wick-like lines, “shadows,” extend from the body, indicating the highest and lowest prices within the period. Patterns and trends help traders analyze market sentiment and make informed decisions.
What is the 3 candle rule?
The 3-candle rule is a pattern in technical analysis involving three consecutive candlesticks. For bullish sentiment, it typically consists of two bearish candles followed by a larger bullish candle, signaling a potential reversal. Conversely, for a bearish trend, it involves two bullish candles followed by a larger bearish candle, indicating a possible downturn. Traders use this pattern to identify shifts in market momentum.
Which candle is best for trading?
There isn’t a single “best” candle for trading, as it depends on the context and strategy. Traders often consider patterns formed by candlesticks, like doji, hammer, or engulfing patterns. Each candle provides different insights into market sentiment. Successful trading involves analyzing multiple candles, patterns, and using them in conjunction with other indicators to make informed decisions.
How to read nifty candle chart?
To read a Nifty candlestick chart, observe each candle representing a time period. The body signifies opening and closing prices, colored green for gains and red for losses. Wick-like lines, shadows, extend from the body, indicating high and low prices. Analyze patterns and trends to assess market sentiment and make informed decisions in Nifty trading.
What is a bullish candle?
A bullish candle in financial markets, depicted on a candlestick chart, has a closing price higher than its opening price. It typically appears green or white. This candle signals optimism and upward momentum,( Hammer ,Bullish Englfing, Bullish harami ,Morning star etc.) indicating that buyers have dominated the market during the specific time period represented by the candle.
What is harami in candlestick?
A harami in candlestick patterns is a two-candle formation indicating potential trend reversal. It consists of a larger candle, followed by a smaller one within its range. The smaller candle’s body is opposite in color to the preceding one, suggesting a shift in market sentiment. Traders often interpret a harami as a sign of indecision and possible trend reversal.
What is triple top pattern?
A triple top pattern is a technical analysis chart pattern where the price of an asset creates three consecutive peaks at nearly the same price level. It often signals a potential trend reversal, with a move downward expected.

